Performance testing of a
Web site is basically the process of understanding how the Web application and
its operating environment respond at various user load levels. In general, we
want to measure the latency, throughput, and utilization of the Web site while
simulating attempts by virtual users to simultaneously access the site. One of
the main objectives of performance testing is to maintain a Web site with
1.
Latency
2.
High throughput
3.
Low
utilization.
First, let's examine these
metrics and their related concepts more closely.
Latency is often called
response time. From a client's perspective, it is the delay experienced between
the point when a request is made and the server's response at the client is
received. It is usually measured in units of time, such as seconds or
milliseconds. In certain testing tools, such as the Microsoft® Web Application
Stress (WAS) tool, latency is best represented by the metric "time to last
byte" (TTLB), which calculates the time between sending out a Web page
request and receiving the last byte of the complete page content.
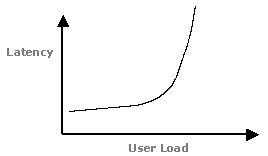
Generally speaking, latency
increases as the inverse of unutilized capacity. It increases slowly at low
levels of user load, but increases rapidly as capacity is utilized. Figure 1
demonstrates such typical characteristics of latency versus user load.

Figure 1.
Typical characteristics of latency versus user load
The sudden increase in
latency is often caused by the maximum utilization of one or more system
resources. For example, most Web servers can be configured to start up a fixed
number of threads to handle concurrent user requests. If the number of
concurrent requests is greater than the number of threads available, any
incoming requests will be placed in a queue and will wait for their turn to be
processed. Any time spent in a queue naturally adds extra wait time to the
overall latency.
To better understand what
latency means in a typical Web farm, we can divide latency into many segments
and categorize these segments into two major types: network latencies and
application latencies. Network latency refers to the time it takes
for data to travel from one server to another. Application latency
is the time required for data to be processed within a server.
Figure 2 shows the
different latencies in the entire process of a typical Web request.

Figure 2.
Different latencies of a typical Web application
As illustrated in Figure 2:
Total
Latency (Response Time) = (N1 + N2 + N3 + N4) + (A1 + A2 + A3)
where Nx represents
the network latencies and Ax represents the application latencies.
In general, the response
time is mainly constrained by N1 and N4. This latency represents the method your
clients are using to access the Internet. In the most common scenario,
e-commerce clients access the Internet using relatively slow dial-up
connections. Once Internet access is achieved, a client's request will spend an
indeterminate amount of time in the Internet cloud shown in Figure 2 as requests
and responses are funneled from router to router across the Internet.
To reduce these network
latencies (N1 and N4), one common solution is to move the servers and/or Web
contents closer to the clients. This can be achieved by hosting your farm of
servers or replicating your Web contents with major Internet hosting providers
who have redundant high-speed connections to major public and private Internet
exchange points, thus reducing the number of network routing hops between the
clients and the servers.
Network latencies N2 and N3
usually depend on the performance of the switching equipment in the server farm.
When traffic to the back-end database grows, consider upgrading the switches and
network adapters to boost performance.
Reducing application
latencies (A1, A2, and A3) is an art form unto itself because the complexity of
server applications can make analyzing performance data and performance tuning
quite challenging. Typically, multiple software components interact on the
server to service a given request. Latency can be introduced by any of the
components. That said, there are ways you can approach the problem:
·
First, your
application design should minimize round trips wherever possible. Multiple round
trips (client to server or application to database) multiply transmission and
resource acquisition latencies. Use a single round trip wherever possible.
·
You can optimize
many server components to improve performance for your configuration. Database
tuning is one of the most important areas on which to focus. Optimize stored
procedures and indexes.
For
more on optimization of stored procedures, see our article Duwamish
Online Stored Procedures.
·
Look for
contention among threads or components competing for common resources. There are
several methods you can use to identify contention bottlenecks. Depending on the
specific problem, eliminating a resource contention bottleneck may involve
restructuring your code, applying service packs, or upgrading components on your
server. Not all resource contention problems can be completely eliminated, but
you should strive to reduce them wherever possible. They can become bottlenecks
for the entire system.
For
more on tracking down contention problems, please refer to the Duwamish Online
articles Contention
Analysis for Web Server Performance and Case
Study: Contention and Scalability Research.
·
Finally, to
increase capacity, you may want to upgrade the server hardware (scaling up), if
system resources such as CPU or memory are stretched out and have become the
bottleneck. Using multiple servers as a cluster (scaling out) may help to lessen
the load on an individual server, thus improving system performance and reducing
application latencies.
For
more information on setting up a Web cluster and a database cluster, please
refer to the Duwamish Online articles Building
a Highly Available and Scalable Web Farm and Building
a Highly Available Database Cluster.
Throughput refers to the
number of client requests processed within a certain unit of time. Typically,
the unit of measurement is requests per second or pages per second. From a
marketing perspective, throughput may also be measured in terms of visitors per
day or page views per day, although smaller time units are more useful for
performance testing because applications typically see peak loads of several
times the average load in a day.
As one of the most useful
metrics, the throughput of a Web site is often measured and analyzed at
different stages of the design, develop, and deploy cycle. For example, in the
process of capacity planning, throughput is one of the key parameters for
determining the hardware and system requirements of a Web site. (See the
Duwamish Online Capacity
Planning article for more information.) Throughput also plays an important
role in identifying performance bottlenecks and improving application and system
performance. Whether a Web farm uses a single server or multiple servers,
throughput statistics show similar characteristics in reactions to various user
load levels. Figure 3 demonstrates such typical characteristics of throughput
versus user load.
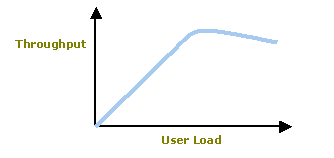
Figure 3.
Typical characteristics of throughput versus user load
As Figure 3 illustrates,
the throughput of a typical Web site increases proportionally at the initial
stages of increasing load. However, due to limited system resources, throughput
cannot be increased indefinitely. It will eventually reach a peak, and the
overall performance of the site will start degrading with increased load.
Maximum throughput, illustrated by the peak of the graph in Figure 3, is the
maximum number of user requests that can be supported concurrently by the site
in the given unit of time.
Different tools provide
various ways to measure and compare throughput. Here are some examples:
·
All Web
performance testing tools should indicate throughput of the site. For example,
the Microsoft Web Application Stress tool shows the requests per second of the
overall test script in its test report.
·
With performance
monitoring tools (such as Performance Logs and Alerts in Microsoft Windows 2000®),
you can monitor and record the following performance counters:
·
Web Service\Get
Requests/second
·
Web Service\Post
Requests/second
·
Active Server
Pages\Requests/second, if the application involves Active Server Pages (ASP).
·
With analysis
tools, you can generate the throughput measurements directly from Web server log
files.
Note that it is sometimes
confusing to compare the throughput metrics for your Web site to the published
metrics of other sites. The value of maximum throughput varies from site to
site. It mainly depends on the complexity of the application. For example, a Web
site consisting largely of static HTML pages may be able to serve many more
requests per second than a site serving dynamic pages. As with any statistic,
throughput metrics can be manipulated by selectively ignoring some of the data.
For example, in your measurements, you may have included separate data for all
the supporting files on a page, such as graphic files. Another site's published
measurements might consider the overall page as one unit. As a result,
throughput values are most useful for comparisons within the same site, using a
common measuring methodology and set of metrics.
In many ways, throughput
and latency are related, as different approaches to thinking about the same
problem. In general, sites with high latency will have low throughput. If you
want to improve your throughput, you should analyze the same criteria as you
would to reduce latency. Also, measurement of throughput without consideration
of latency is misleading because latency often rises under load before
throughput peaks. This means that peak throughput may occur at a latency that is
unacceptable from an application usability standpoint. This suggests that
performance reports include a cut-off value for latency, such as:
250
requests/second @ 5 seconds maximum latency
Utilization refers to the
usage level of different system resources, such as the server's CPU(s), memory,
network bandwidth, and so forth. It is usually measured as a percentage of the
maximum available level of the specific resource.
Utilization versus user
load for a Web server typically produces a curve, as shown in Figure 4.
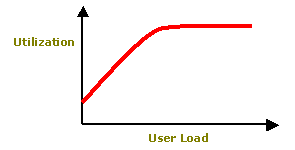
Figure 4.
Typical characteristics of utilization versus user load
As Figure 4 illustrates,
utilization usually increases proportionally to increasing user load. However,
it will top off and remain at a constant when the load continues to build up.
If the specific system
resource tops off at 100-percent utilization, it's very likely that this
resource has become the performance bottleneck of the site. Upgrading the
resource with higher capacity would allow greater throughput and lower
latency—thus better performance. If the measured resource does not top off
close to 100-percent utilization, it is probably because one or more of the
other system resources have already reached their maximum usage levels. They
have become the performance bottleneck of the site.
To locate the bottleneck,
you may need to go through a long and painstaking process of running performance
tests against each of the suspected resources, and then verifying if performance
is improved by increasing the capacity of the resource. In many cases,
performance of the site will start deteriorating to an unacceptable level well
before the major system resources, such as CPU and memory, are maximized. For
example, Figure 5 illustrates a case where latency (response time) rises sharply
to 45 seconds when CPU utilization has reached only 60 percent.
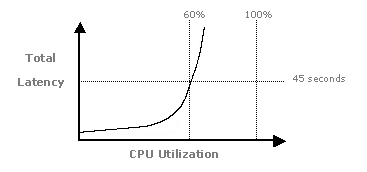
Figure 5.
An example of latency versus utilization
As Figure 5 demonstrates,
monitoring the CPU or memory utilization alone may not always indicate the true
capacity level of the server farm with acceptable performance.